
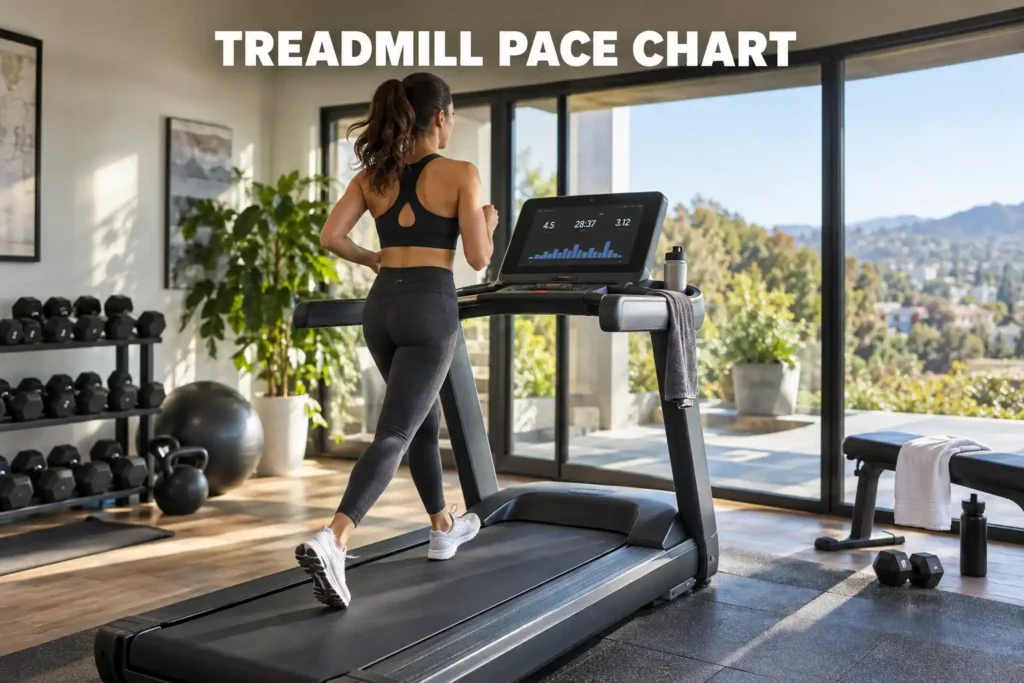
If you have ever stared at a treadmill display showing 7.5 mph and had no idea what that means as a running pace, you are in good company. TechFitnessLab's treadmill pace chart below converts every common speed setting into the min/mile and min/km values runners actually use for training. This guide covers the full treadmill speed to pace chart, how incline changes the equation, speed zones from walking to sprinting, and average benchmarks by age and fitness level - everything you need to run smarter on any machine.

Treadmill Pace Chart - Speed-to-Pace Reference for Every Runner
A treadmill pace chart translates the machine's speed readout into the same terms runners use outdoors: minutes per mile or minutes per kilometer. The formula is simple: divide 60 by your speed in mph to get your pace in minutes per mile.
The treadmill speed to pace km chart below lists each speed from 2.0 to 12.0 mph alongside its min/km and min/mile equivalents.
Speed (mph) | Speed (km/h) | Pace (min/mile) | Pace (min/km) | Zone |
2.0 | 3.2 | 30:00 | 18:38 | Easy walk |
2.5 | 4.0 | 24:00 | 14:54 | Walk |
3.0 | 4.8 | 20:00 | 12:26 | Walk |
3.5 | 5.6 | 17:09 | 10:39 | Brisk walk |
4.0 | 6.4 | 15:00 | 9:19 | Brisk walk |
4.5 | 7.2 | 13:20 | 8:17 | Brisk walk/jog |
5.0 | 8.0 | 12:00 | 7:27 | Light jog |
5.5 | 8.9 | 10:54 | 6:46 | Jog |
6.0 | 9.7 | 10:00 | 6:12 | Jog |
6.5 | 10.5 | 9:14 | 5:44 | Jog/run |
6.7 | 10.8 | 8:57 | 5:33 | Run |
7.0 | 11.3 | 8:34 | 5:19 | Run |
7.5 | 12.1 | 8:00 | 4:58 | Run |
8.0 | 12.9 | 7:30 | 4:39 | Run |
8.5 | 13.7 | 7:03 | 4:22 | Fast run |
9.0 | 14.5 | 6:40 | 4:08 | Fast run |
9.5 | 15.3 | 6:19 | 3:55 | Fast run |
10.0 | 16.1 | 6:00 | 3:44 | Sprint |
10.5 | 16.9 | 5:43 | 3:33 | Sprint |
11.0 | 17.7 | 5:27 | 3:23 | Sprint |
12.0 | 19.3 | 5:00 | 3:06 | Sprint |
Calculations use the formula: pace (min/mile) = 60 / speed (mph). Kilometer equivalents use the conversion factor 1.60934.
Save or print this treadmill pace chart for quick reference during training - pin it near the treadmill or save it to your phone.
How to Read and Use This Treadmill Speed Chart
Reading this treadmill speed chart takes seconds. Find your current speed in the left column, then read across to your equivalent pace. If your half-marathon goal is a 9:00 min/mile, you need 6.5-6.7 mph on the machine. If your training plan calls for easy-effort running, anything in the 5.0-5.5 mph range fits that description for most runners.
Three ways to use this treadmill pace conversion reference immediately:
- Match indoor sessions to outdoor training plans. If your plan calls for an 8:30 min/mile tempo run, set the treadmill to 7.1 mph.
- Track fitness progress over time. When the same speed setting starts to feel easier, your fitness is improving - the chart keeps that reference point consistent.
- Set accurate race-day preparation. Running at your target race pace indoors makes the effort feel familiar on race day.
I typically suggest bookmarking this chart during your first month of treadmill training - it removes the mental overhead of calculating pace mid-workout, which is when most people accidentally under-pace their intervals.
For a full guide on session setup including safety key, incline calibration, and belt speed protocols, my guide on using a treadmill correctly walks through the full process step by step.
Race Pace Equivalents
Knowing your treadmill speed is even more useful when you can see what it means on race day. The table below projects finish times at common training speeds across four standard race distances.
Speed (mph) | Pace (min/mile) | 5K | 10K | Half Marathon | Marathon |
6.0 | 10:00 | 31:04 | 1:02:08 | 2:11:05 | 4:22:11 |
6.5 | 9:14 | 28:41 | 57:21 | 2:01:01 | 4:02:01 |
7.0 | 8:34 | 26:38 | 53:16 | 1:52:22 | 3:44:44 |
7.5 | 8:00 | 24:51 | 49:43 | 1:44:53 | 3:29:45 |
8.0 | 7:30 | 23:18 | 46:36 | 1:38:19 | 3:16:38 |
8.5 | 7:03 | 21:56 | 43:52 | 1:32:33 | 3:05:07 |
9.0 | 6:40 | 20:43 | 41:25 | 1:27:24 | 2:54:47 |
Projected finish times assume constant speed throughout. Real-race conditions - hills, tangents, and pacing variance - will produce slightly different results.
If you are using this pace chart to structure a full training block, my guide to training for a marathon on a treadmill covers how to structure weekly mileage and long runs using indoor speed settings.
Treadmill Pace Chart with Incline - How Grade Changes the Math
A flat treadmill setting does not replicate outdoor running. Research published in PLOS One found that overground running requires meaningfully higher energy output than treadmill running at a 1% grade across multiple metrics including running economy and oxygen cost of transport, with the difference intensifying at higher intensities (1). Research quantifying this energy gap underscores why 1% incline is the accepted minimum starting point for treadmill training and any treadmill pace chart with incline calibration.
The 1% Incline Rule
The 1% incline rule means setting your treadmill to 1% grade to better simulate the energy cost of flat outdoor running. At that setting, the absence of air resistance and the belt's assistance roughly cancel out, and effort more closely mirrors road running.
A validation study by Foreman et al. confirmed that speed-incline conversion charts maintain equivalent physiological intensity accurately at grades up to 4% - but at 6% and higher, supposedly equivalent stages produce meaningfully elevated cardiovascular demand (2). That has two practical implications:
- For steady-state and tempo runs, the 1% rule works accurately
- For steep incline intervals above 5%, the effort spike is real and exceeds what the pace number alone suggests
The table below shows approximate flat-pace equivalents at higher grades, useful when you use this treadmill pace chart with incline for structured workouts.
Incline (%) | 5.0 mph flat equivalent | 6.0 mph flat equivalent | 7.0 mph flat equivalent |
0% | 12:00/mile | 10:00/mile | 8:34/mile |
1% | 11:44/mile | 9:46/mile | 8:22/mile |
3% | 11:15/mile | 9:22/mile | 8:00/mile |
5% | 10:50/mile | 9:00/mile | 7:41/mile |
8% | 10:10/mile | 8:27/mile | 7:13/mile |
10% | 9:44/mile | 8:06/mile | 6:55/mile |
12% | 9:20/mile | 7:46/mile | 6:38/mile |
Values are approximate and based on ACSM oxygen cost equations at moderate aerobic effort. Individual responses vary by fitness level and running economy.
For runners who regularly train on grade, having a treadmill that holds its calibration at high inclines matters. Our best incline treadmill guide covers models with the widest reliable grade range.
Treadmill Speed Zones - Walking, Jogging, Running, and Sprinting
Understanding speed zones turns the treadmill pace chart from a lookup table into a training tool. Energy expenditure increases with treadmill speed, and the body switches primary muscles, gait mechanics, and fuel sources at each threshold - the transition from walking to jogging and from jogging to running involves a meaningful increase in effort (3).
Zone | Speed (mph) | Speed (km/h) | Effort Level | Typical Use |
Easy walk | 2.0-3.0 | 3.2-4.8 | Very light | Warm-up, cool-down, active recovery |
Brisk walk | 3.0-4.2 | 4.8-6.8 | Light | Low-impact cardio, 12-3-30 workouts |
Walk/jog transition | 4.2-5.0 | 6.8-8.0 | Moderate | Base-building, beginner running |
Easy jog | 5.0-6.0 | 8.0-9.7 | Moderate | Long runs, recovery jogs |
Moderate run | 6.0-7.5 | 9.7-12.1 | Moderately hard | Tempo runs, 5K-10K training |
Fast run | 7.5-9.0 | 12.1-14.5 | Hard | Intervals, race simulation |
Sprint | 9.0+ | 14.5+ | Very hard | HIIT, short max-effort intervals |
Most recreational runners spend their training in the 5.0-8.0 mph range. Knowing your zone makes it far easier to use a treadmill pace calculator or treadmill conversion chart alongside a structured plan. For those whose goals stay in the walking zones, our best under-desk treadmill roundup covers machines purpose-built for that 2.0-4.0 mph range.
Two speeds that come up frequently are 6.7 mph (8:57 per mile) and the 7.5 treadmill pace (8:00 per mile). Both sit in the moderate run zone and serve as common benchmark targets for runners training for 5K to half-marathon distances. I use the 7.5 treadmill pace as a practical reference for runners working toward a sub-2-hour half marathon.
If you are also tracking step count alongside pace, my guide to how many steps in a mile on a treadmill breaks down step counts by speed and stride length.
When I point runners to the most practically useful zones from this treadmill speed to pace chart, these three come up most often:
- Easy jog zone (5.0-6.0 mph) - long runs, base-building miles, and any session where you should hold a comfortable conversation throughout
- Moderate run zone (6.0-7.5 mph) - tempo runs, steady-state cardio, and race-pace training for most 5K to 10K runners
- Fast run zone (7.5-9.0 mph) - interval repeats, speed work, and threshold training for experienced runners building speed
Most consumer home treadmills cap out at 12 mph, while commercial gym models often reach 15 mph or more. The max speed on a treadmill matters primarily for sprint intervals - for most distance training, anything above 10 mph rarely comes into play.
The popular 12-3-30 workout - 3 mph at 12% incline for 30 minutes - sits in the brisk walk zone by speed but produces surprisingly high cardiovascular demand because of the steep grade. That is why it became such an accessible but effective option for people who do not run.
Tracking pace zones in real time is far easier when your treadmill pairs with a fitness watch. Our article on what a smartwatch does explains how wrist-based devices log treadmill sessions and flag when you drift outside your target zone.
Average Treadmill Speed by Age and Fitness Level
The treadmill pace chart becomes more meaningful when you know where your current numbers fit relative to your age group. Aerobic capacity (VO2peak) declines significantly with age - research on master runners found a strong negative correlation between age and VO2peak (r = -0.580, p = 0.001), though running economy remained partially preserved in experienced distance athletes (4).

That decline is real, but it does not mean pace is predetermined by your birthday. Fitness level consistently overrides age as a predictor of treadmill mile pace.
Age Group | Beginner (mph) | Intermediate (mph) | Advanced (mph) | Elite (mph) |
20-29 | 4.5-5.5 | 5.5-7.5 | 7.5-9.5 | 9.5+ |
30-39 | 4.5-5.5 | 5.5-7.0 | 7.0-9.0 | 9.0+ |
40-49 | 4.0-5.0 | 5.0-6.5 | 6.5-8.5 | 8.5+ |
50-59 | 3.5-4.5 | 4.5-6.0 | 6.0-7.5 | 7.5+ |
60+ | 3.0-4.0 | 4.0-5.5 | 5.5-7.0 | 7.0+ |
These are approximate guidelines for recreational runners. Individual fitness history, training volume, and health status matter more than age alone.
A key takeaway: a highly active 55-year-old will typically run a faster treadmill mile pace than a sedentary 25-year-old. Research tracking cardiac patients over 10 years found that those maintaining moderate walking speed on a treadmill test - around 5.5 km/h - showed lower mortality risk than the slowest walkers, confirming that even moderate consistent paces produce measurable health benefits (5).
For a home machine that holds calibration across the full speed range these benchmarks represent, our best treadmill for home roundup covers motorized models built for serious training.
How to Calculate Treadmill Pace - The Simple Formula
You do not always have a printable treadmill pace chart nearby. The manual calculation is fast once you know it.

Pace (min/mile) = 60 / Speed (mph)
Common examples:
- 6.0 mph: 60 / 6.0 = 10:00 min/mile
- 6.7 mph: 60 / 6.7 = 8:57 min/mile
- 7.5 mph: 60 / 7.5 = 8:00 min/mile
- 9.0 mph: 60 / 9.0 = 6:40 min/mile
- 10.0 mph: 60 / 10.0 = 6:00 min/mile
To calculate treadmill pace in min/km, first convert mph to km/h by multiplying by 1.60934, then divide 60 by the result:
Pace (min/km) = 60 / (Speed in mph x 1.60934)
So 7.5 mph becomes 12.07 km/h, and 60 / 12.07 = 4:58 min/km. A treadmill pace calculator automates this if you prefer not to do the math manually.
To work the formula in reverse - finding your treadmill speed from a target outdoor pace - divide 60 by your goal pace:
Speed (mph) = 60 / Pace (min/mile)
A goal pace of 8:30 per mile gives 60 / 8.5 = 7.06 mph on the machine.
Research shows treadmill walking actually demands slightly more gross energy expenditure than overground walking at the same speed (6). If your early outdoor runs feel easier than your usual treadmill pace suggests, that elevated treadmill demand may be the reason - your aerobic base is stronger than the outdoor equivalent suggests.
If you also want to track how many calories you burn at each pace, my treadmill calorie counter covers the formulas and a speed-by-speed breakdown.
I always recommend saving a printable treadmill pace chart near the machine or setting it as your phone's lock screen background during training cycles. That removes the mental calculation from workouts and keeps you focused on effort rather than arithmetic.
For a compact machine that holds speed accurately in the mid-range where most training happens, the best folding treadmill options cover apartment-friendly models with reliable calibration.
Putting the Treadmill Pace Chart to Work
The treadmill pace chart is most valuable when it connects to a goal rather than floating as an abstract reference. Knowing that 7.5 mph equals an 8:00 min/mile matters when that information anchors a race-prep session or a threshold workout.
I see a consistent pattern among runners who train primarily indoors and then struggle at outdoor events: they ran at 0% incline, chose comfortable rather than prescribed speeds, and never stress-tested their equivalent outdoor pace. The conversion chart and the incline table in this guide are the two tools that close that gap.
Here is how to apply this treadmill pace chart by training type:
- Key workout sessions: target 6.5-8.0 mph at 1% incline for tempo runs and interval work
- Recovery days: keep speed in the easy jog zone (4.5-5.5 mph) so you do not accumulate unnecessary fatigue
- Race simulation: match your goal race pace from the treadmill speed to pace chart and hold it for 20-40 minutes to build race-specific confidence
- Fitness checks: every 4-6 weeks, run a set speed for 5 minutes and track heart rate - improvement means lower heart rate at the same speed
Sample Treadmill Workouts
30-minute tempo run: Warm up at 5.5 mph for 5 minutes, hold 7.0 mph at 1% incline for 20 minutes, cool down at 5.0 mph for 5 minutes. Use the pace chart to confirm 7.0 mph equals your 8:34 min/mile target pace.
20-minute interval session: Alternate 60-second pushes at 8.0-8.5 mph with 90-second recoveries at 5.0 mph for 6-8 rounds. The speed zone table shows this range sits in the fast run zone - intervals here build speed and aerobic capacity simultaneously.
An often-overlooked variation that enhances treadmill training is walking backwards on the belt at low speed. Our article on the benefits of walking backwards on a treadmill explores how that variation targets posterior chain muscles and provides active recovery without dropping cardiovascular demand entirely.
FAQs
What is a good pace on a treadmill?
A good pace on a treadmill depends on your fitness level and goal, but for general cardiovascular health the range of 5.0-6.5 mph (a 9:14-12:00 min/mile jog) suits most recreational runners. Beginners building endurance may find 4.0-4.5 mph appropriate for brisk walking, while trained runners targeting race fitness typically work in the 6.5-8.0 mph range for their primary sessions.
What is the 30 minute treadmill rule?
The 30 minute treadmill rule refers to the viral 12-3-30 workout: walking at 3 mph on a 12% incline for 30 continuous minutes. The steep grade elevates cardiovascular demand significantly despite the slow walking speed, making it a highly accessible and effective low-impact workout that many users maintain consistently as their primary cardio session.
Those choosing between the treadmill and a stair climber for their primary cardio session will find a full evidence-based comparison in my stairmaster vs treadmill guide, including calorie estimates across intensities.
How fast is 7.0 on a treadmill?
A treadmill speed of 7.0 mph translates to an 8:34 min/mile pace (5:19 min/km), placing it solidly in the moderate running zone for most recreational athletes. At that pace, you complete a mile roughly every 8.5 minutes, which would finish a 5K in approximately 26 minutes and a 10K in around 53 minutes.
What pace is 4.5 on a treadmill?
At 4.5 mph on a treadmill, your pace is 13:20 min/mile (8:17 min/km), which falls in the brisk-walk-to-light-jog transition zone. It is faster than a typical walking pace but slower than most jogging speeds, making it a comfortable starting point for new runners or a genuine active-recovery pace for more experienced ones.
This content is for informational and educational purposes only. It is not a substitute for professional medical advice, diagnosis, or treatment. Always consult with your healthcare provider before starting any new fitness program or using fitness technology for health monitoring.
References:
- Shahidi SH, Can R, Paça FM, Zengin MD. Overground running incurs a higher energetic cost than treadmill running at a 1% grade: A comparison of running economy, oxygen cost of transport, and energy cost in endurance athletes. PLOS One. 2026;21(8):e0355988. doi:10.1371/journal.pone.0355988
- Foreman NA, Lee EJ, Lundstrom CJ. Assessment of a Treadmill Speed Incline Conversion Chart: A Validation Study. International Journal of Sports Physiology and Performance. 2022;17(7):1030-1036. doi:10.1123/ijspp.2021-0021
- Makino A, Yamaguchi K, Sumi D, et al. Comparison of energy expenditure and substrate oxidation between walking and running in men and women. Physical Activity and Nutrition. 2022;26(1). doi:10.20463/pan.2022.0002
- Lee EJ, Snyder EM, Lundstrom CJ. The relationships between age and running performance variables in master runners. Sport Science and Health. 2019;15(3):543-550. doi:10.1007/s11332-019-00543-3
- Chiaranda G, Bernardi E, Codeca L, et al. Treadmill walking speed and survival prediction in men with cardiovascular disease: a 10-year follow-up study. BMJ Open. 2013;3(10):e003446. doi:10.1136/bmjopen-2013-003446
- Das Gupta S, Kamishita K, Kondo M, Kobayashi Y. Use Treadmills with Caution: Walking Energy Expenditure and Metabolic Cost Are Elevated Compared to Overground Across Multiple Speeds in Healthy Young Adults. Journal of Functional Morphology and Kinesiology. 2026;11(2):220. doi:10.3390/jfmk11020220