
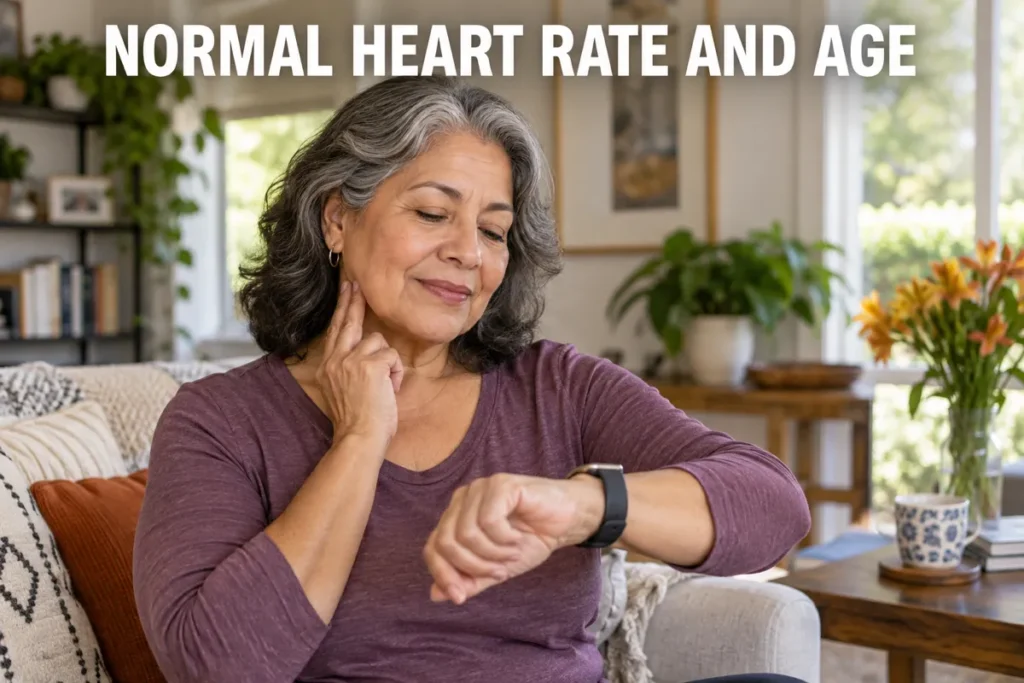
Understanding normal heart rate and age is one of the most practical things you can take from a fitness tracker. The number on your wrist means something different at 25, at 55, and at 75 - and knowing those differences changes how you respond to what you see. In this guide, I cover the resting heart rate ranges for every major life stage - including how normal heart rate for men and women can differ - the factors that shift your reading, and the specific situations where a tracker number is worth a call to your doctor.

Normal Heart Rate and Age - What the Numbers Actually Mean
The standard normal heart rate for adults sits between 60 and 100 beats per minute (bpm). That range has held up in clinical practice for decades, though newer research confirms that highly trained individuals can sit well below that threshold and remain perfectly healthy. A resting heart rate is measured when you are sitting or lying quietly, not during or immediately after activity.
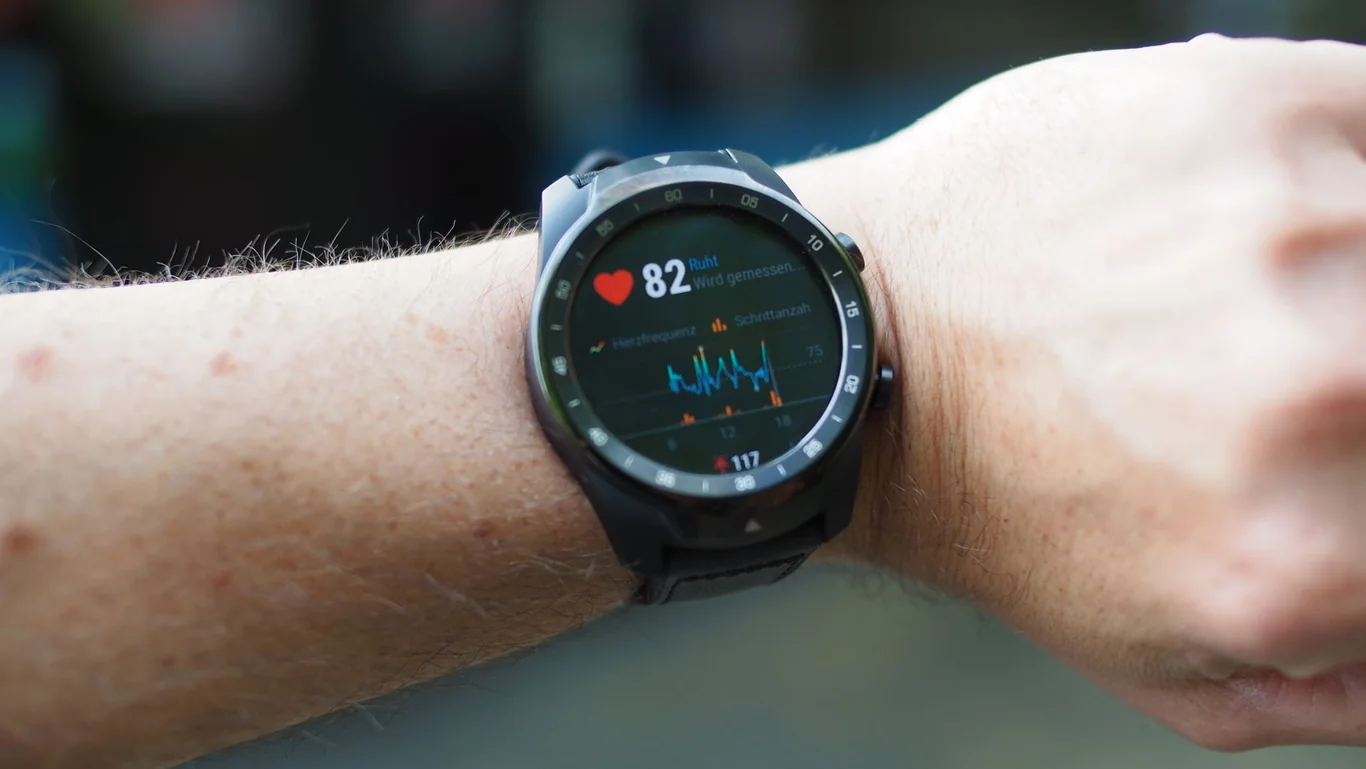
What most people miss is how dramatically the normal pulse rate shifts across the lifespan. A reading of 150 bpm in a newborn is completely normal. For a senior in their 70s, a reading in the high 80s may carry more clinical significance than the same number in a healthy 30-year-old. The number alone tells only part of the story.
For context on how accurately consumer devices capture these readings, our guide to how accurate smart watches are for heart rate breaks down the technology and its real-world limitations. The short answer is that wrist-based sensors estimate rather than measure, and understanding that distinction matters when you interpret your data.
Normal Resting Heart Rate Ranges by Age Group
The normal heart rate by age reference ranges below reflect evidence-based clinical thresholds; pediatric values are drawn from validated PALS references (1), while adult ranges reflect the clinical definition of normal sinus rhythm (6, 7). Use this resting heart rate chart as a general reference, not as a diagnostic tool:
Age Group | Normal Resting Heart Rate |
Newborns (0-6 months) | 100-160 bpm |
Infants (6-12 months) | 80-140 bpm |
Toddlers (1-2 years) | 80-130 bpm |
Preschool (2-5 years) | 60-120 bpm |
School age (5-12 years) | 60-110 bpm |
Teens (12-17 years) | 60-100 bpm |
Adults (18-64 years) | 60-100 bpm |
Seniors (65+) | 60-100 bpm |
These are population-level reference ranges, not personal targets. Your individual baseline matters more than any chart. Tracking your normal pulse rate for adults as a daily morning trend gives more actionable insight than comparing to any single reference value. An active 45-year-old with a resting heart rate of 52 bpm is not alarming - that number reflects good cardiovascular conditioning, not pathology.
Apple Watch makes that baseline tracking automatic overnight, and my Apple Watch sleep data guide breaks down what the watch records and how to interpret the results.
Studies consistently find that normal heart rate for men averages 2-7 bpm lower than for women of the same age, primarily due to differences in cardiac size and hormonal regulation. This means normal heart rate and age reference ranges apply broadly to both sexes, but individual readings can vary based on sex, body size, and training history.
The connection between normal heart rate and age carries long-term health implications that go beyond reassurance. In adults aged 20-49, research shows each 10-bpm increment in resting heart rate corresponds to meaningfully higher all-cause mortality risk over time (2). In adults over 60, elevated resting heart rate independently predicts cardiovascular events and overall mortality - an association that appears more pronounced in older populations than in younger cohorts (3).
For a deeper look at how heart rate variability by age relates to long-term cardiovascular health, our guide on heart rate variability by age covers that topic in full.
How to Manually Check Your Resting Heart Rate
The most accurate way to measure resting heart rate is by hand, before you reach for your device. Place two fingers on the inside of your wrist below the thumb (radial pulse), or press lightly on the side of your neck (carotid pulse). Count beats for a full 60 seconds. Measure in the morning, seated, after at least five minutes of quiet rest and before coffee - this eliminates the main confounders that push the number up. My own readings using my Garmin Forerunner over the past year have settled consistently at 61-63 bpm, matching what I'd expect for someone with a regular 4-day aerobic routine.
How Age Changes Your Resting Heart Rate
Age does not change the normal range itself. Adults at 25 and adults at 75 are both measured against the same 60-100 bpm adult standard. What age changes is how you move within that range and what factors drive your number. Reviewing the normal heart rate by age chart above alongside your own trend data gives a clearer picture of where you sit in the distribution for your life stage.
VO2max follows a parallel pattern, declining with each decade but remaining highly trainable, and my VO2max norms by age guide covers what scores look like across every life stage.

Three primary mechanisms shift resting heart rate across the lifespan and affect normal heart rate and age trajectories for most people:
- Declining cardiovascular fitness - decades of reduced aerobic activity gradually push resting heart rate upward, since a less-efficient heart must beat more often to meet the same resting demands
- Medication prevalence - beta-blockers, calcium channel blockers, and certain antidepressants are all common in older adults and directly lower resting heart rate; stimulant medications push it upward
- Autonomic nervous system changes - the heart's intrinsic pacemaker function becomes less responsive with age, narrowing the achievable heart rate range at both the high and low ends
A prospective cohort of 5,042 adults with a mean age of 75.3 years found that elevated resting heart rate independently predicted a 1.79-fold increased risk of decline in daily functional activities over a 3.2-year follow-up period (4). This suggests that for older adults, monitoring resting heart rate chart trends over months and years provides practical value as one data point among many.
Factors That Affect Your Resting Heart Rate
Once you understand normal heart rate and age baselines for your age group, the next step is understanding what shifts your reading within that range. The normal heart rate for adults can change by 10-20 bpm within a single day based on factors completely unrelated to heart health. Knowing what drives those swings prevents you from overreacting to a morning spike or dismissing a persistent elevation.
Fitness Level and Regular Exercise
Consistent aerobic exercise is the factor with the most direct, controllable influence on resting heart rate. Training that elevates your heart rate for sustained periods - particularly in the zone 2 heart rate training zone - teaches the heart to pump more blood per beat, reducing how many beats it needs at rest. Elite endurance athletes commonly sit at 40-50 bpm. Even a moderate routine of three to four aerobic sessions per week can lower resting heart rate by up to 5-10 bpm over several months, though systematic reviews suggest average reductions are closer to 3-5 bpm.
Activities that challenge the cardiovascular system efficiently include cycling, brisk walking, swimming, and rowing, which recruits the full body and builds aerobic capacity without excessive joint stress. If you want to understand your target heart rate for fat burning or set effective training zones, your resting heart rate trend is the baseline to build from.
My fat-burning heart rate guide takes that resting heart rate baseline and translates it into the specific training intensity zones to target during cardio sessions for fat oxidation.
Stress, Anxiety, and Stimulants
Caffeine is one of the most underestimated drivers of elevated resting heart rate. Acute doses in non-habitual drinkers can raise resting heart rate temporarily - though habitual coffee drinkers typically develop tolerance and see a much smaller acute effect. Energy drinks, certain decongestants, and pre-workout supplements produce similar responses. People frequently notice their fitness tracker showing an elevated reading after coffee and interpret it as a health signal - this is normal physiology, not a warning.
Stress and anxiety activate the sympathetic nervous system, releasing adrenaline that elevates heart rate directly. There is also a feedback loop that makes this worse for anxious individuals: noticing a high number on a wearable creates more anxiety, which elevates the number further. I tracked this directly during a high-workload two-week period in early 2026 - my Garmin's morning readings climbed from 62 to 70 bpm before returning to baseline once the workload normalized, with no underlying cardiac explanation. Poor sleep, dehydration, and high ambient temperatures each push resting heart rate upward by similar mechanisms.
Body Composition, Medications, and Medical Conditions
The following table summarizes the most common factors that shift resting heart rate and the direction of their effect:
Factor | Effect on Resting Heart Rate |
Regular aerobic exercise | Lowers 5-15 bpm over weeks to months |
Caffeine (2 cups, non-habitual users) | Raises 5-20 bpm temporarily (habitual users: smaller effect) |
Poor sleep (one night) | Raises resting HR noticeably |
Chronic stress | Raises 5-15 bpm persistently |
Beta-blocker medications | Lowers 10-20+ bpm |
Hyperthyroidism | Raises 10-30+ bpm |
Hypothyroidism | Lowers 5-20 bpm |
Fever (each 1 degree Celsius) | Raises approximately 10 bpm |
Mild to moderate dehydration | Raises 5-15 bpm |
Hyperthyroidism drives heart rate upward; hypothyroidism slows it. Anemia often elevates resting heart rate as the heart compensates for reduced oxygen delivery. Larger body size generally correlates with higher resting heart rate because the heart must circulate blood through a greater volume.
A systematic review and meta-analysis of 12 cohort studies found a linear relationship between resting heart rate and hypertension risk - each 10-bpm increment in resting heart rate corresponded with about a 9% higher relative risk of developing high blood pressure (5). For older adults managing multiple cardiovascular risk factors, this connection between resting heart rate and blood pressure underscores why tracking both vital signs together has practical value.
When to Worry About Low Heart Rate
A resting heart rate below 60 bpm is clinically defined as bradycardia, with emerging consensus that the more clinically significant threshold may be below 50 bpm (6). But context determines whether this reading signals a problem or excellent fitness. For older adults especially, whether a low reading signals concern depends more on accompanying symptoms than on the number itself.
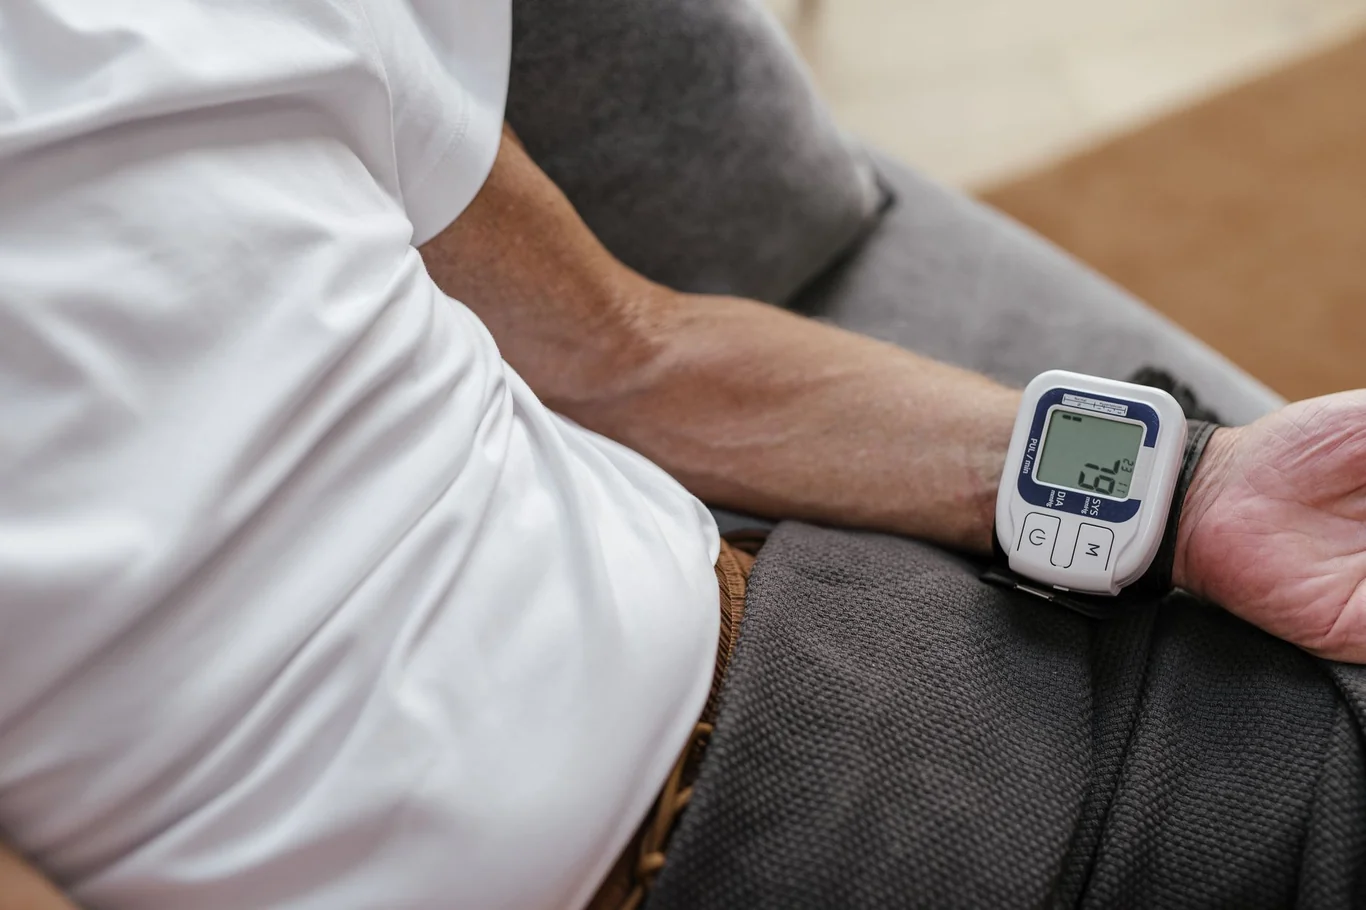
For trained athletes and physically active individuals, a low resting heart rate is expected and healthy. Endurance athletes routinely sustain rates in the low 40s with no symptoms and no risk. The clinical standard acknowledges this - bradycardia in a fit, asymptomatic person is not treated as pathology.
The concern with bradycardia emerges when any of the following symptoms appear:
- Dizziness or lightheadedness when standing
- Unusual fatigue or weakness unrelated to exertion
- Shortness of breath with normal daily activities
- Fainting or near-fainting episodes
- Confusion or difficulty concentrating
If your tracker consistently shows readings below 50 bpm and you experience any of those symptoms, that combination warrants a conversation with your doctor. A symptom-free person seeing 55 bpm at rest does not need urgent evaluation.
Smartwatch and fitness tracker readings can also reflect poor sensor contact rather than true bradycardia - a low reading at the wrist while you are cold, have poor circulation, or are wearing the device loosely can be a measurement artifact. Learning how to check heart rate on iPhone using the built-in Health app, or cross-referencing with a dedicated pulse oximeter, helps confirm whether a low reading is real.
Understanding what a smartwatch does beyond step counting - including how it captures heart rate data in real time - gives you the context to judge whether a low reading warrants concern.
What Is a Dangerous Heart Rate - Warning Signs to Know
A resting heart rate above 100 bpm is clinically defined as tachycardia (7). Like bradycardia, this threshold requires context. A reading of 110 bpm immediately after climbing stairs is expected physiology. A sustained reading of 110 bpm while sitting quietly at rest is a different matter entirely.
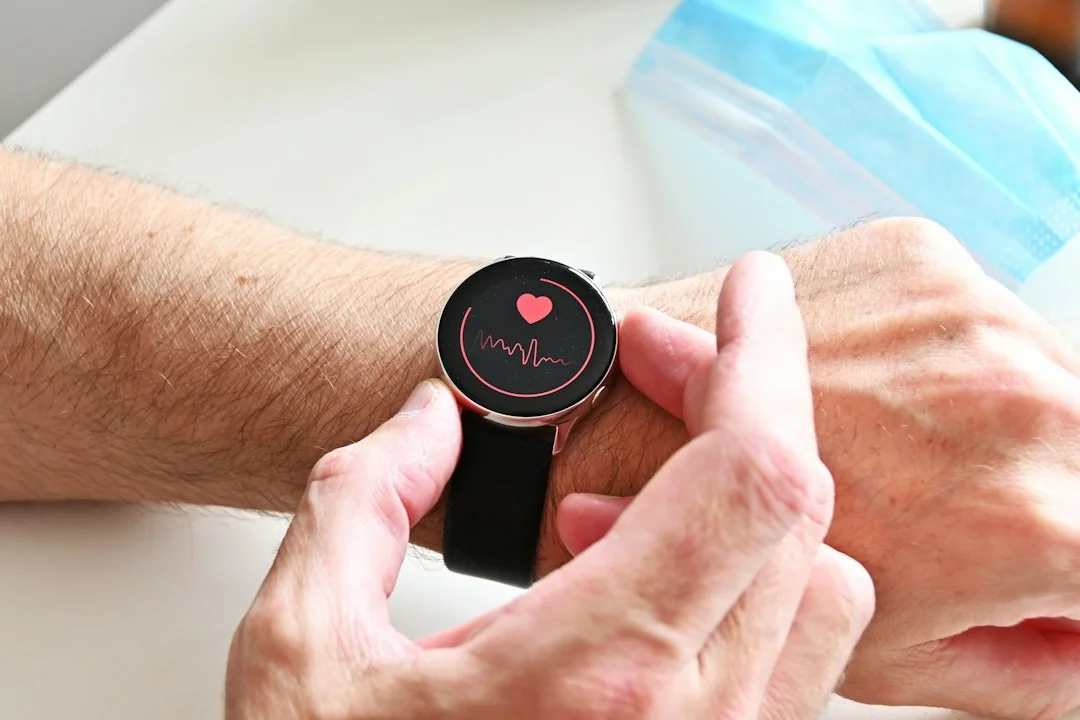
Research tracking middle-aged men across a lifetime found a U-shaped relationship between resting heart rate and cardiovascular mortality. The optimal range was 60-70 bpm, with both very low readings and readings above 70 bpm associated with elevated risk over time - including the 70-80 bpm range, which carried a statistically significant increase in cardiovascular mortality compared to the reference group (8). This does not mean a consistent reading of 75 bpm is an emergency - it means chronic elevation across years is worth addressing through lifestyle changes.
The symptoms that transform a high reading into a genuine red flag include:
- Chest pain or pressure during or independent of activity
- Palpitations - a fluttering, racing, or pounding sensation in the chest
- Shortness of breath at rest or with minimal exertion
- Dizziness or fainting with an elevated heart rate
- Swelling in the legs or ankles combined with persistently elevated HR
A resting heart rate consistently above 120-130 bpm with any of those accompanying symptoms warrants prompt medical evaluation. An isolated reading of 95 bpm with no symptoms, after two coffees, on a high-stress morning, is almost certainly a combination of normal physiological drivers.
Understanding what is a dangerous heart rate in context requires knowing your personal baseline - the number alone rarely tells the complete story. Knowing how to calculate max heart rate also helps you put resting readings in perspective relative to your personal heart rate range.
Reading Your Fitness Tracker Numbers - What the Data Actually Tells You
Fitness trackers and smartwatches measure heart rate using photoplethysmography - an optical sensor that detects blood flow changes through the skin. Consumer wearables are generally accurate enough for resting heart rate trends, but they are estimating based on optical signals, not measuring the electrical activity that a clinical ECG would capture. For more precise readings, a chest strap heart rate monitor makes contact with the chest wall directly and provides significantly better accuracy during both rest and exercise.
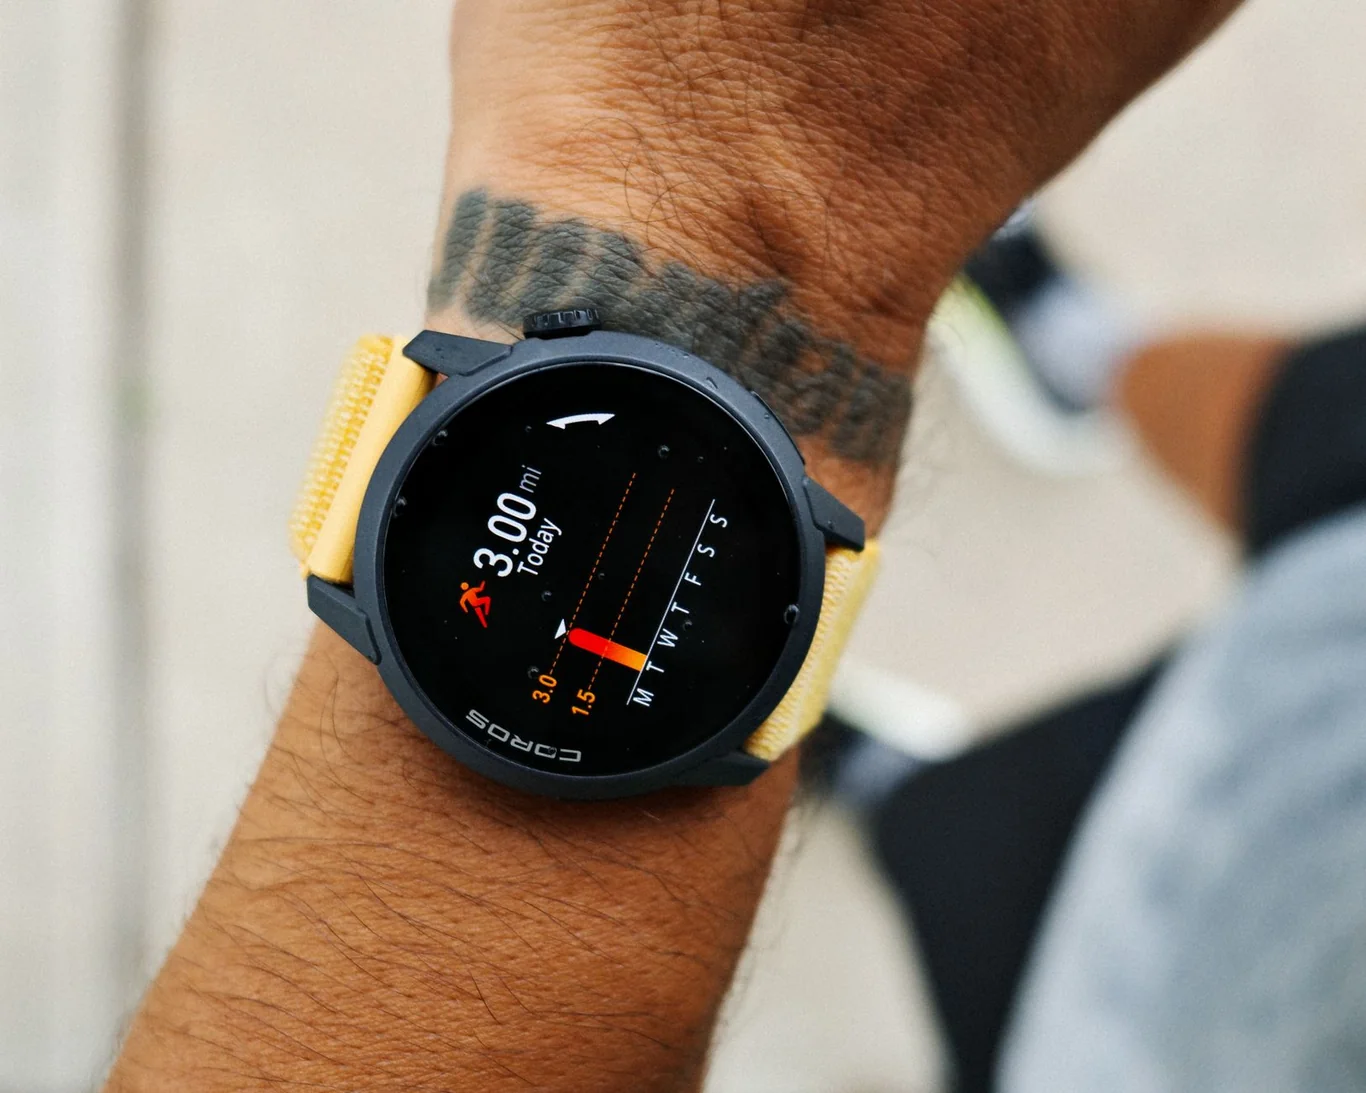
Regarding heart rate variability, a systematic review of 57 studies spanning 1989-2022 found significant heterogeneity across methods and populations, with no universally accepted HRV reference values established (9). This means HRV readings from consumer wearables should be treated as directional trends, not clinical benchmarks.
I compared optical wrist readings on my Garmin Forerunner against a chest strap monitor over 30 mornings and found an average discrepancy of 2.3 bpm at rest - small enough for trend tracking, but meaningful if you are managing a cardiac condition and relying on the device for medical-adjacent monitoring.
For more precise resting and active measurements, my chest strap accuracy breakdown covers which devices perform closest to ECG reference.
Comparing devices is also worth doing if accuracy matters to you. Our direct comparison of Garmin vs Apple Watch accuracy gives a performance breakdown for the two most popular platforms.
Reading your normal heart rate and age data consistently and meaningfully requires a few practical habits:
- Measure resting heart rate in the same conditions each time - ideally in the morning, before coffee, after sitting quietly for five minutes
- Look at trends across days and weeks, not individual readings
- Note what external factors (poor sleep, caffeine, illness, stress) preceded any elevated reading
- Use a consistent trend over two to four weeks, not a single spike, as your signal to investigate further
A single elevated reading almost never means anything on its own. A resting rate that has trended upward from 64 to 80 bpm over two months without a clear cause is worth discussing with your doctor.
How to Lower Your Resting Heart Rate Over Time
The most reliable way to lower a resting heart rate that sits at the high end of normal is consistent aerobic exercise. A stronger heart pumps more blood per beat, so it needs fewer beats to meet your body's resting demands. Research and clinical practice consistently support this connection - the mechanism is well understood and the effect size is meaningful.

A practical approach that builds this adaptation:
- Start with three sessions per week of moderate-intensity aerobic activity (walking briskly, cycling, swimming)
- Gradually extend each session to 30-45 minutes as fitness improves
- Include at least one longer, easier session per week that keeps you in your zone 2 heart rate training zone
- Track your morning resting heart rate weekly as a trend indicator of cardiovascular adaptation
Monitoring your normal heart rate when running during training sessions helps you calibrate your effort zones and see how your normal heart rate and age baseline compares to your active heart rate over time. Your resting rate going down while your fitness improves is one of the clearest confirmation signals that training is working.
Other evidence-supported strategies for lowering normal pulse rate for adults over time include:
- Improving sleep quality - even a few nights of poor sleep can raise your resting heart rate noticeably; research consistently links sleep duration and quality to resting HR trends
- Reducing caffeine intake - cutting daily caffeine by half can lower resting HR in caffeine-sensitive individuals within a few days
- Managing chronic stress - breathing exercises, mindfulness practices, and regular relaxation reduce sympathetic nervous system activity
- Staying well hydrated - dehydration raises heart rate as a compensatory mechanism that resolves quickly once fluid intake is restored
Low-impact aerobic movement like walking backwards on a treadmill or gentle cycling provides cardiovascular benefit while minimizing joint stress - a useful option for people recovering from illness, injury, or returning to exercise after a long break. The cardiovascular adaptation accumulates regardless of the specific activity, as long as the intensity is sufficient to elevate heart rate moderately.
Your Heart Rate Data in the Bigger Picture
Normal heart rate and age are connected in ways that go beyond a reference chart. The number on your tracker is a data point inside a system that includes your fitness level, sleep quality, stress load, medication use, and underlying health status. A reading of 78 bpm means something different for a 25-year-old distance runner than for a sedentary 65-year-old on a beta-blocker.
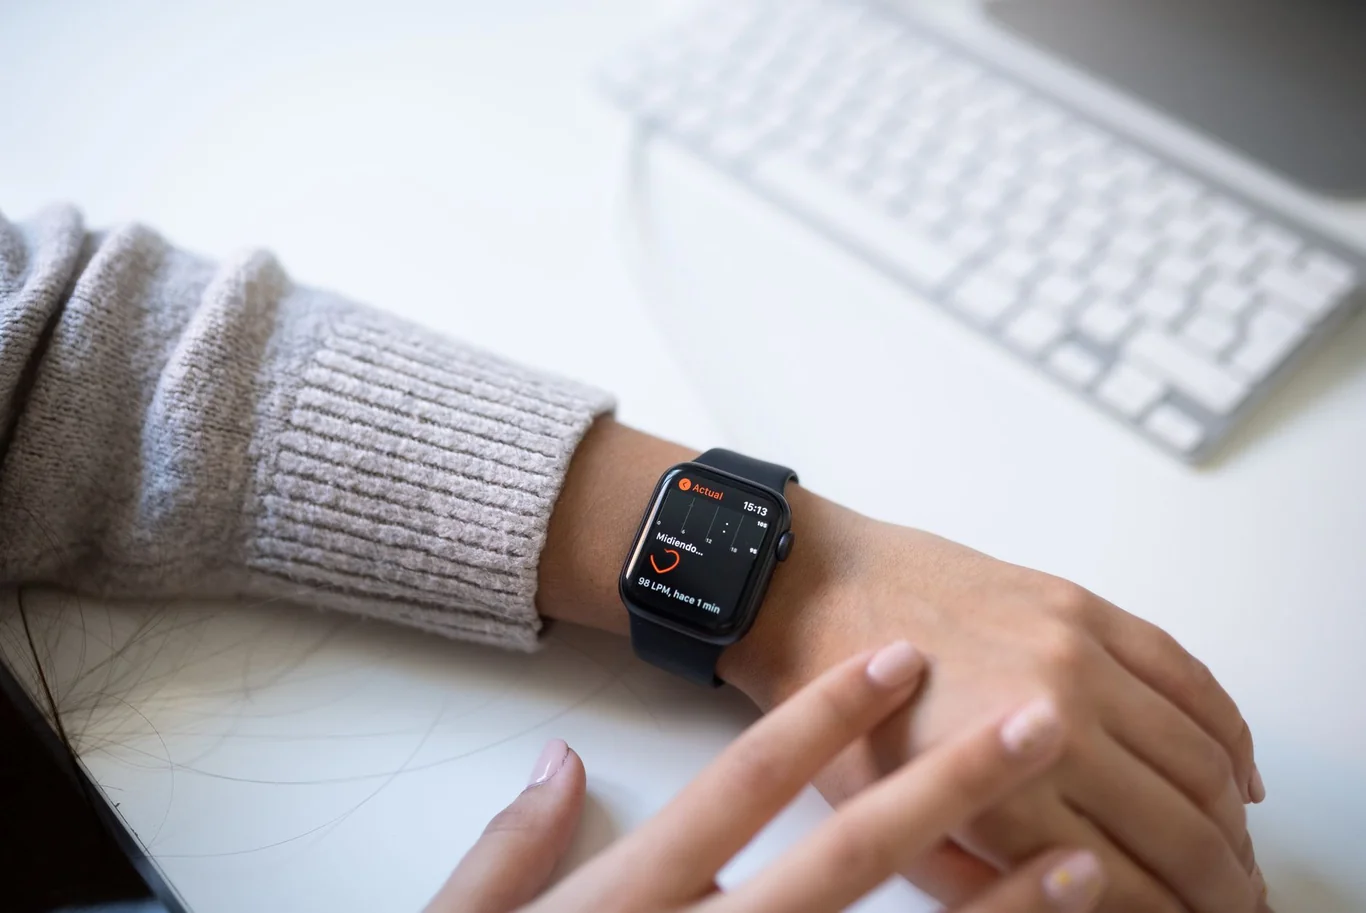
The most practical insight from tracking normal heart rate and age data is that the trend matters far more than any single reading. A resting rate that has crept from 62 to 76 bpm over two years, without a change in fitness habits or medications, is worth a conversation with your doctor. A one-time spike to 95 bpm on a stressful Monday morning is almost certainly not.
It is also worth knowing that the normal respiratory rate in adults - typically 12-20 breaths per minute - is another vital sign that shifts alongside heart rate during illness, stress, and exertion. Some modern wearables now estimate both, though the normal respiratory rate in adults measurement on consumer devices carries the same caveats as optical heart rate: it is an estimate, not a measurement, and context matters.
Use your normal pulse rate as a personal baseline, note what external factors affect it, and focus on the lifestyle variables you can control. How to check heart rate on iPhone using the Health app, or checking with a quality wrist or finger pulse oximeter, gives you a low-friction way to log your readings consistently enough to see a meaningful trend.
FAQs
What are four signs your heart is in trouble?
The four most recognized warning signs of cardiac trouble are chest pain or pressure, shortness of breath at rest or with minimal exertion, palpitations (a racing, fluttering, or irregular heartbeat), and unexplained dizziness or fainting. Any combination of these symptoms alongside an abnormal resting heart rate - whether very high or very low - warrants prompt medical evaluation rather than a wait-and-see approach.
What is a red flag heart rate?
A red flag resting heart rate is one that consistently exceeds 100 bpm or falls below 50 bpm, particularly when accompanied by symptoms such as dizziness, chest discomfort, shortness of breath, or fainting. A single high reading in isolation - especially with a clear cause like caffeine, stress, or recent exertion - rarely signals a problem. A sustained pattern over days or weeks is what warrants clinical attention.
What is an unhealthy heart rate?
An unhealthy resting heart rate is one that persistently sits outside the standard 60-100 bpm reference range without a clear physiological explanation - or one that falls below 50 bpm without the fitness context that makes a lower number normal. Context matters considerably - a resting rate of 55 bpm in a trained athlete is a marker of excellent fitness, while the same reading in a sedentary older adult experiencing dizziness warrants further investigation. The 50 bpm threshold is where clinicians begin looking more closely for underlying causes, regardless of accompanying symptoms.
What is the normal pulse rate for seniors over 70?
The normal pulse rate for seniors over 70 falls within the same 60-100 bpm adult reference range, though readings toward the higher end of normal become more common with age due to declining fitness, medication effects, and changes in autonomic nervous system function. Seniors should pay particular attention to symptoms accompanying their heart rate readings, as research shows elevated resting heart rate in adults over 60 is more strongly associated with functional decline and cardiovascular risk than in younger populations.
What is normal blood pressure by age?
Normal blood pressure is generally defined as below 120/80 mmHg for adults at all ages, though systolic pressure tends to rise gradually with age due to arterial stiffening. The American Heart Association classifies readings above 130/80 mmHg as stage 1 hypertension. Heart rate and blood pressure are related but distinct measurements - a normal heart rate does not guarantee normal blood pressure, and both should be part of a complete cardiovascular health picture rather than monitored in isolation.
This content is for informational and educational purposes only. It is not a substitute for professional medical advice, diagnosis, or treatment. Always consult with your healthcare provider before starting any new fitness program or using fitness technology for health monitoring.
References
- Dudas RA, Berezow JK. 5, 4, 3, 2, 1, 0: An evidence-based mnemonic to aid recall and interpretation of heart rate values for pediatric patients presenting for acute care. AEM Education and Training. 2024. doi:10.1002/aet2.11012.
- Chen H, Chen Q, Wang Y. Resting heart rate and long-term mortality in young adults: a population-based cohort study. Open Heart. 2026;13(2):e004279. doi:10.1136/openhrt-2026-004279.
- Li K, Yao C, Yang X, Dong L. Does the impact of resting heart rate on cardiovascular disease and all-cause deaths differ by age? Journal of the American Geriatrics Society. 2016;65(4):e106-e111. doi:10.1111/jgs.14745.
- Ogliari G, Mahinrad S, Stott DJ, et al. Resting heart rate, heart rate variability and functional decline in old age. Canadian Medical Association Journal. 2015;187(15):E442-E449. doi:10.1503/cmaj.150023.
- Shen L, Wang Y, Jiang X, et al. Dose-response association of resting heart rate and hypertension in adults: A systematic review and meta-analysis of cohort studies. Medicine (Baltimore). 2020;99(48):e23247. doi:10.1097/MD.0000000000023247.
- StatPearls Publishing. Sinus Bradycardia. In: StatPearls [Internet]. Updated 2025 Jul 3.
- StatPearls Publishing. Sinus Tachycardia. In: StatPearls [Internet]. Updated 2024 Apr 1.
- Cui X, Mandalenakis Z, Thunstrom E, et al. The impact of time-updated resting heart rate on cause-specific mortality in a random middle-aged male population: a lifetime follow-up. Clinical Research in Cardiology. 2020;110(7):1048-1056. doi:10.1007/s00392-020-01753-3.
- Brozat M, Bockelmann I, Sammito S. Systematic Review on HRV Reference Values. Journal of Cardiovascular Development and Disease. 2025;12(1):22. doi:10.3390/jcdd12010022.